What this article covers
- What the BI tool Quick Sight is
- The benefits of using Quick Sight
- How to introduce Quick Sight
How does your company use the data it has built up, such as sales by customer, sales by product, and HR data?
Have you ever thought how easy it would be if your data were charted in the cloud and made visible, or wanted to use your stored data for management and sales growth?
In this article, we introduce QuickSight, a tool that makes data visible and helps with management and sales growth.
This article is for you if you want to
- make your data visible and use it for management and sales growth
- quickly aggregate data and see analysis results whenever a question comes to mind
- learn about BI tools
- learn about QuickSight
What is a BI tool, and what is QuickSight?
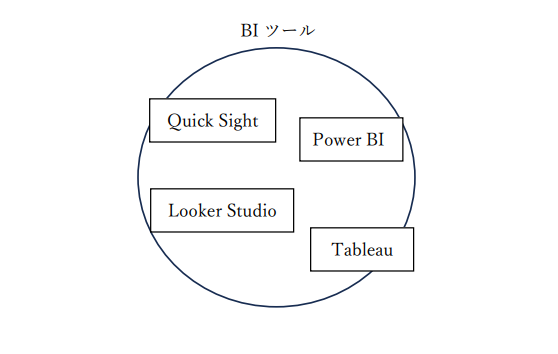
QuickSight is a BI tool. Other BI tools include Power BI from Microsoft, Looker Studio from Google, and Tableau, whose parent company is Salesforce.
Some of you may be wondering what a BI tool is in the first place.
A BI tool is software that analyzes and visualizes the various data a company holds so that it can be used in management and daily work. It makes data analysis easy, helps you understand your current situation and issues accurately, and lets you take the right measures.
It can also automate aggregation and charting work that takes hours every month. For example, you can show reports on sales by customer, by product, by branch, and by month in one place.
Visualizing sales by product shows you which products to focus on, and sales by customer lets you increase advertising to the groups most likely to buy. In this way, you can take measures that lead to better management and higher sales.
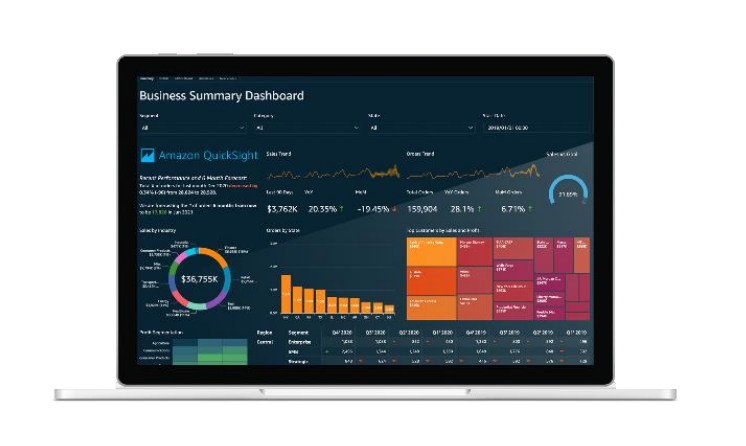
QuickSight is a BI tool that makes full use of AWS features. Its main features are:
- charts, reports, and dashboards from a wide range of database services
- dashboards that stay comfortable to use even under heavy load, thanks to automatic scaling on AWS
- strong security, pay as you go pricing, and clear visuals
Benefits of QuickSight
1. Clear design
It supports many chart types, such as pie charts, bar charts, and line charts. Dashboards that bring these charts together on one screen can be customized to be easy to read.
2. A choice of databases
It can aggregate data from many databases, such as SQL Server, MySQL, Oracle, S3, RDS, and Redshift, so it fits a wide range of situations.
3. Always comfortable access
With AWS Auto Scaling, which automatically adds infrastructure to handle traffic spikes, the display does not slow down even as data volume or access grows, so you can always view your data reliably.
4. Strong security
With AWS features such as CloudTrail and IAM, you can detect unauthorized access in the logs and separate permissions for each user, strengthening the security of QuickSight.
If you would like us to introduce QuickSight for you, here is how it works until you start using it.
How we introduce QuickSight
- Application and contract: after your application, we complete the contract procedures.
- Interviews: we decide the output items and chart types in QuickSight.
- Database connection: we check whether we can connect to your database.
- Dashboard creation: we access your environment and make the initial settings.
- Start of use: after connecting, we give you the dashboard URL and you can start using it.
QuickSight can be set up quickly, and steps 4 and 5 can be done as soon as the same day. We will discuss the delivery date with you separately.
Finally, SYSLABO is an official AWS Partner. Because we know AWS well and always have the latest information, we can make proposals to improve your environment beyond QuickSight.
When more specialized skills are needed, we make proposals using not only our own knowledge but also the expertise of AWS Japan.
If you want to know whether something is possible or what can be done, please feel free to contact us.